The United States is home to some of the world’s most iconic and influential office buildings; structures that define skylines, anchor business districts, and support millions of workers every day. While the commercial real estate landscape continues to evolve, one thing remains constant: large-format office buildings play an outsized role in corporate strategy, urban planning, and economic productivity.
From sprawling low-rise corporate campuses to towering skyscrapers, America’s largest office buildings reflect the country’s history of innovation, ambition, and scale. These buildings are more than workplaces – they are ecosystems that support collaboration, technology, and culture at a massive scale.
Below, we explore the significance of these mega office assets and present a verified Top 100 list of the largest office buildings in the United States, ranked by square footage and including story counts and completion years.
Why Large Office Buildings Matter
1. Operational Efficiency at Scale
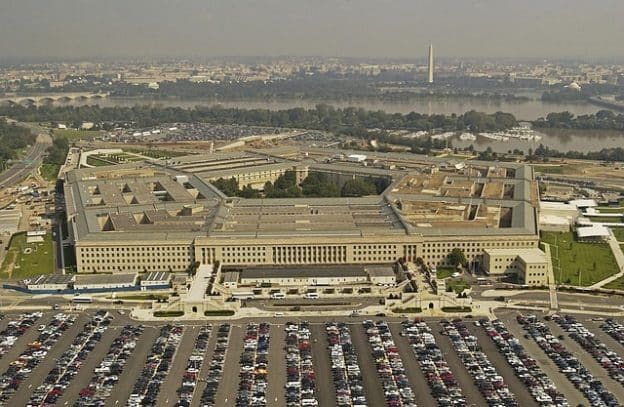
Large office buildings allow companies and government agencies to consolidate operations, reduce redundancies, and centralize talent. Buildings like The Pentagon and USAA Headquarters demonstrate how scale can support complex, high security, mission critical operations.
2. Urban and Economic Anchors
Mega office buildings often serve as anchors for entire districts. Chicago’s Willis Tower and New York’s One World Trade Center are not just workplaces – they are economic engines that support retail, hospitality, transit, and tourism.
3. Architectural and Engineering Innovation
Many of America’s largest office buildings pushed the boundaries of engineering at the time of construction. The bundled tube structure of Willis Tower, the advanced security and sustainability systems of One World Trade Center, and the massive floor plates of the Merchandise Mart all represent milestones in commercial architecture.
4. Adaptability and Longevity
Large office buildings tend to have long lifespans and are frequently adapted for new uses. The Merchandise Mart, once a wholesale hub, is now a center for design, tech, and innovation.
Regional Patterns in America’s Largest Office Buildings
Chicago: The Capital of Mega Office Footprints
Chicago dominates the list with buildings like Willis Tower, Aon Center, and the Merchandise Mart, each exceeding 3 million square feet.
New York City: Vertical Density at Its Peak
New York contributes many of the tallest and most iconic office towers, including One World Trade Center, 55 Water Street, and the MetLife Building.
Washington, D.C.: Government Scale
Federal buildings such as the Pentagon and the Ronald Reagan Building represent some of the largest office footprints in the world.
Corporate Campuses: The Low Rise Giants
Buildings like IBM Rochester and Apple Park demonstrate that the largest office buildings are not always skyscrapers – some are sprawling horizontal campuses.
The Future of Mega Office Buildings
As hybrid work reshapes demand, large office buildings are evolving rather than disappearing. Owners are investing in:
- High-performance HVAC and air quality systems
- Flexible floor plates for hybrid collaboration
- Amenity-rich environments that attract employees
- Sustainability upgrades to meet ESG goals
Mega office buildings remain highly relevant for organizations that require secure, centralized, or large-scale operations.

Top 100 Largest Office Buildings in the United States
Includes buildings that are a majority of office use. Ranked by total square feet. Includes square feet, stories, and completion year.
Ranks 1 – 25
| Rank | Building | City & State | Sq Ft | Stories | Year |
|---|---|---|---|---|---|
| 1 | The Pentagon | Arlington, VA | 6,673,000 | 7 | 1943 |
| 2 | Chrysler World Headquarters & Tech Center | Auburn Hills, MI | 5,398,000 | 15 | 1996 |
| 3 | USAA Corporate Headquarters | San Antonio, TX | 4,994,000 | 4 | 1976 |
| 4 | Willis Tower | Chicago, IL | 4,477,000 | 108 | 1974 |
| 5 | Merchandise Mart | Chicago, IL | 4,004,000 | 25 | 1930 |
| 6 | Aon Center | Chicago, IL | 3,600,000 | 83 | 1973 |
| 7 | One World Trade Center | New York, NY | 3,500,000 | 104 | 2014 |
| 8 | 55 Water Street | New York, NY | 3,500,000 | 53 | 1972 |
| 9 | MetLife Building | New York, NY | 3,142,000 | 59 | 1963 |
| 10 | Ronald Reagan Building | Washington, DC | 3,121,000 | 15 | 1998 |
| 11 | IBM Rochester | Rochester, MN | 3,121,000 | 3 | 1958 |
| 12 | 111 Eighth Avenue | New York, NY | 2,906,000 | 18 | 1932 |
| 13 | John Hancock Center (office portion) | Chicago, IL | 2,800,000 | 100 | 1969 |
| 14 | Apple Park (office portion) | Cupertino, CA | 2,798,000 | 4 | 2017 |
| 15 | 30 Hudson Yards (office portion) | New York, NY | 2,600,000 | 103 | 2019 |
| 16 | 28 Liberty Street | New York, NY | 2,292,000 | 66 | 1961 |
| 17 | U.S. Steel Tower | Pittsburgh, PA | 2,260,000 | 64 | 1971 |
| 18 | 555 California Street | San Francisco, CA | 1,800,000 | 52 | 1969 |
| 19 | 1290 Avenue of the Americas | New York, NY | 2,100,000 | 43 | 1964 |
| 20 | Bank of America Plaza | Atlanta, GA | 1,900,000 | 55 | 1992 |
| 21 | 200 West Street (Goldman Sachs HQ) | New York, NY | 2,100,000 | 44 | 2009 |
| 22 | 300 North LaSalle | Chicago, IL | 1,500,000 | 60 | 2009 |
| 23 | Salesforce Tower (office portion) | San Francisco, CA | 1,600,000 | 61 | 2018 |
| 24 | 101 California Street | San Francisco, CA | 1,450,000 | 48 | 1982 |
| 25 | 1999 Avenue of the Stars | Los Angeles, CA | 1,400,000 | 44 | 1970 |
Ranks 26 – 50
| Rank | Building | City & State | Sq Ft | Stories | Year |
|---|---|---|---|---|---|
| 26 | 500 West Madison | Chicago, IL | 1,422,000 | 42 | 1987 |
| 27 | 300 East Randolph | Chicago, IL | 1,399,000 | 57 | 2010 |
| 28 | 101 Park Avenue | New York, NY | 1,400,000 | 49 | 1982 |
| 29 | 1801 K Street NW | Washington, DC | 1,390,000 | 13 | 1970 |
| 30 | 200 Public Square | Cleveland, OH | 1,350,000 | 45 | 1985 |
| 31 | 919 Third Avenue | New York, NY | 1,450,000 | 47 | 1971 |
| 32 | 300 South Riverside Plaza | Chicago, IL | 1,300,000 | 35 | 1983 |
| 33 | 100 North Riverside | Chicago, IL | 1,300,000 | 36 | 1990 |
| 34 | 101 North Wacker | Chicago, IL | 1,250,000 | 30 | 1980 |
| 35 | 333 West Wacker Drive | Chicago, IL | 1,250,000 | 36 | 1983 |
| 36 | 100 East Pratt Street | Baltimore, MD | 1,250,000 | 28 | 1975 |
| 37 | 1001 Pennsylvania Avenue NW | Washington, DC | 1,300,000 | 14 | 1987 |
| 38 | 500 Fifth Avenue | New York, NY | 1,250,000 | 60 | 1931 |
| 39 | 101 Federal Street | Boston, MA | 1,300,000 | 31 | 1988 |
| 40 | 100 Summer Street | Boston, MA | 1,300,000 | 32 | 1974 |
| 41 | 300 North Meridian | Indianapolis, IN | 1,200,000 | 31 | 1989 |
| 42 | 100 Peachtree | Atlanta, GA | 1,200,000 | 32 | 1968 |
| 43 | 1100 Peachtree | Atlanta, GA | 1,250,000 | 28 | 1990 |
| 44 | 1001 Fannin | Houston, TX | 1,300,000 | 47 | 1981 |
| 45 | 1100 Louisiana | Houston, TX | 1,250,000 | 55 | 1980 |
| 46 | 600 Travis | Houston, TX | 1,700,000 | 75 | 1982 |
| 47 | 1600 Smith Street | Houston, TX | 1,200,000 | 51 | 1983 |
| 48 | 1201 Louisiana | Houston, TX | 1,300,000 | 55 | 1983 |
| 49 | 1000 Main | Houston, TX | 1,200,000 | 36 | 2003 |
| 50 | 811 Main | Houston, TX | 1,100,000 | 46 | 2017 |
Ranks 51 – 75
| Rank | Building | City & State | Sq Ft | Stories | Year |
|---|---|---|---|---|---|
| 51 | 1000 Louisiana | Houston, TX | 1,200,000 | 56 | 1981 |
| 52 | 1010 Lamar | Houston, TX | 1,200,000 | 20 | 1980 |
| 53 | 1100 Milam | Houston, TX | 1,100,000 | 55 | 1972 |
| 54 | 1400 Smith Street | Houston, TX | 1,200,000 | 50 | 1983 |
| 55 | 150 North Riverside | Chicago, IL | 1,200,000 | 54 | 2017 |
| 56 | 155 North Wacker | Chicago, IL | 1,200,000 | 46 | 2009 |
| 57 | 191 North Wacker | Chicago, IL | 1,100,000 | 37 | 2002 |
| 58 | 225 West Wacker Drive | Chicago, IL | 1,100,000 | 31 | 1989 |
| 59 | 233 South Wacker (Annex) | Chicago, IL | 1,100,000 | 40 | 1980 |
| 60 | 300 South Wacker | Chicago, IL | 1,100,000 | 36 | 1971 |
| 61 | 333 South Wabash | Chicago, IL | 1,200,000 | 44 | 1973 |
| 62 | 500 North Michigan | Chicago, IL | 1,100,000 | 24 | 1968 |
| 63 | 600 West Chicago | Chicago, IL | 1,200,000 | 7 | 1908 |
| 64 | 1001 Brickell Bay Drive | Miami, FL | 1,100,000 | 32 | 1986 |
| 65 | Southeast Financial Center | Miami, FL | 1,225,000 | 55 | 1984 |
| 66 | 701 Brickell Avenue | Miami, FL | 1,100,000 | 33 | 1986 |
| 67 | 777 Brickell Avenue | Miami, FL | 1,100,000 | 14 | 1983 |
| 68 | 100 North Tampa | Tampa, FL | 1,000,000 | 42 | 1992 |
| 69 | Bank of America Plaza | Tampa, FL | 1,000,000 | 42 | 1986 |
| 70 | 101 East Kennedy | Tampa, FL | 1,000,000 | 36 | 1986 |
| 71 | 400 North Tampa | Tampa, FL | 1,000,000 | 42 | 1992 |
| 72 | 100 South Ashley Drive | Tampa, FL | 1,000,000 | 28 | 1981 |
| 73 | 100 Biscayne Boulevard | Miami, FL | 1,000,000 | 30 | 1972 |
| 74 | 100 East Pratt Street | Baltimore, MD | 1,100,000 | 28 | 1975 |
| 75 | 750 East Pratt Street | Baltimore, MD | 1,000,000 | 18 | 1992 |
Ranks 76 – 100
| Rank | Building</ | City & State | Sq Ft | Stories | Year |
|---|---|---|---|---|---|
| 76 | 100 East Wisconsin | Milwaukee, WI | 1,000,000 | 37 | 1989 |
| 77 | 411 East Wisconsin Center | Milwaukee, WI | 1,000,000 | 30 | 1985 |
| 78 | Northwestern Mutual Tower (office portion) | Milwaukee, WI | 1,100,000 | 32 | 2017 |
| 79 | 100 North Broadway | St. Louis, MO | 1,000,000 | 36 | 1977 |
| 80 | One Metropolitan Square | St. Louis, MO | 1,000,000 | 42 | 1989 |
| 81 | 909 Chestnut | St. Louis, MO | 1,000,000 | 44 | 1986 |
| 82 | 100 South Fourth Street | St. Louis, MO | 1,000,000 | 25 | 1983 |
| 83 | 100 North Main | Memphis, TN | 1,000,000 | 37 | 1965 |
| 84 | 333 Clay | Houston, TX | 1,200,000 | 50 | 1980 |
| 85 | 1600 Smith Street | Houston, TX | 1,200,000 | 51 | 1983 |
| 86 | 717 Texas Avenue | Houston, TX | 1,000,000 | 33 | 2003 |
| 87 | 1001 McKinney | Houston, TX | 1,000,000 | 24 | 1947 |
| 88 | 1000 Wilshire Boulevard | Los Angeles, CA | 1,000,000 | 53 | 1987 |
| 89 | 1055 West Seventh Street | Los Angeles, CA | 1,000,000 | 32 | 1988 |
| 90 | 550 South Hope Street | Los Angeles, CA | 1,000,000 | 28 | 1987 |
| 91 | 400 South Hope Street | Los Angeles, CA | 1,100,000 | 55 | 1982 |
| 92 | 601 South Figueroa | Los Angeles, CA | 1,000,000 | 42 | 1990 |
| 93 | 633 West Fifth Street (office portion) | Los Angeles, CA | 1,100,000 | 73 | 1989 |
| 94 | 650 California Street | San Francisco, CA | 1,000,000 | 34 | 1964 |
| 95 | 44 Montgomery Street | San Francisco, CA | 1,000,000 | 43 | 1967 |
| 96 | 345 California Center (office portion) | San Francisco, CA | 1,000,000 | 48 | 1986 |
| 97 | 50 Fremont Center | San Francisco, CA | 1,000,000 | 42 | 1983 |
| 98 | 600 Montgomery Street | San Francisco, CA | 1,000,000 | 38 | 1984 |
| 99 | 101 Montgomery Street | San Francisco, CA | 1,000,000 | 28 | 1984 |
| 100 | 333 Bush Street | San Francisco, CA | 1,000,000 | 43 | 1986 |
Disclaimer: Information was obtained from sources we deem reliable, but it is not guaranteed to be fully accurate